Published: 2024-04-25T06:43:21.000Z
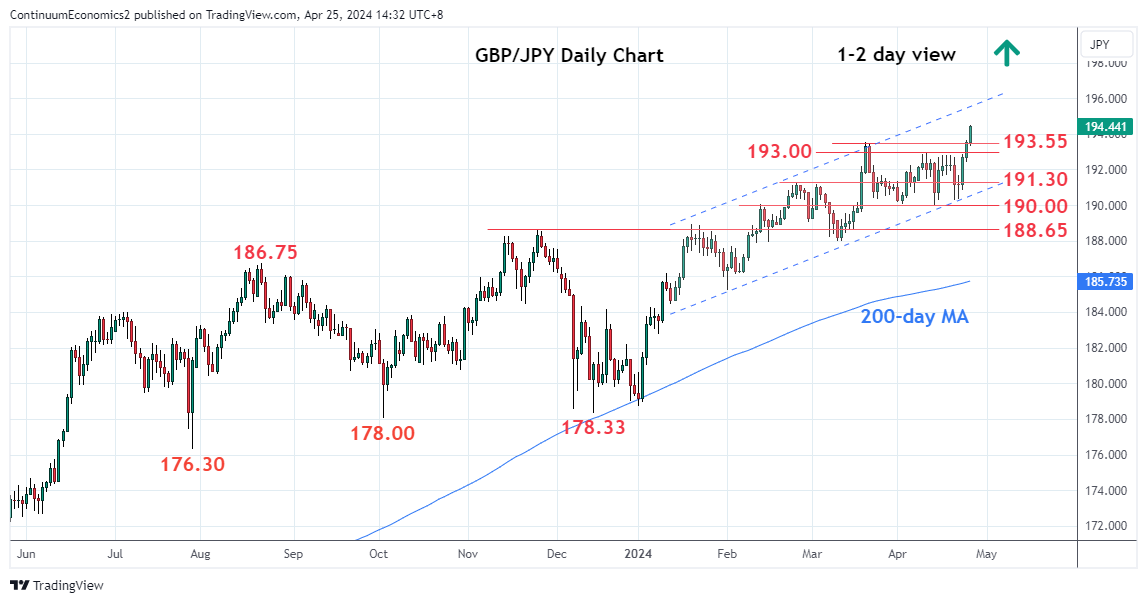
Chart GBP/JPY Update: Focus shift to 195.85, 2015 year high

Technical Analyst
-
Choppy trade below the 193.55/193.00 high has given way to break to further extend the underlying bull trend from the 2020 year low
| Levels | Imp | Comment | Levels | Imp | Comment | |||
|---|---|---|---|---|---|---|---|---|
| R4 | 200.00 | ** | figure | S1 | 193.55/00 | * | Mar high, congestion | |
| R3 | 197.45 | * | 24 Sep 2008 high | S2 | 191.30 | * | Feb high | |
| R2 | 195.85 | ** | Jun 2015 year high | S3 | 190.00 | * | 12 Apr low, congestion | |
| R1 | 195.25 | * | Aug 2015 high | S4 | 188.65 | * | Nov high |
Asterisk denotes strength of level
06:30 GMT - Choppy trade below the 193.55/193.00 high has given way to break to further extend the underlying bull trend from the 2020 year low. Focus now shift to the 195.25/195.85, August/June 2015 multi-year high. Overbought daily studies suggest test here to give way to consolidation before break higher expected. Clearance, if seen, will shift focus to the see room to highs of 2008 at 197.45 then the 200.00 figure. Meanwhile support is raised to the 193.55/193.00 area and should now underpin and limit immediate pullback.