Published: 2024-04-25T11:51:49.000Z
Chart USD/RUB Update: Under pressure

Senior Technical Strategist
1
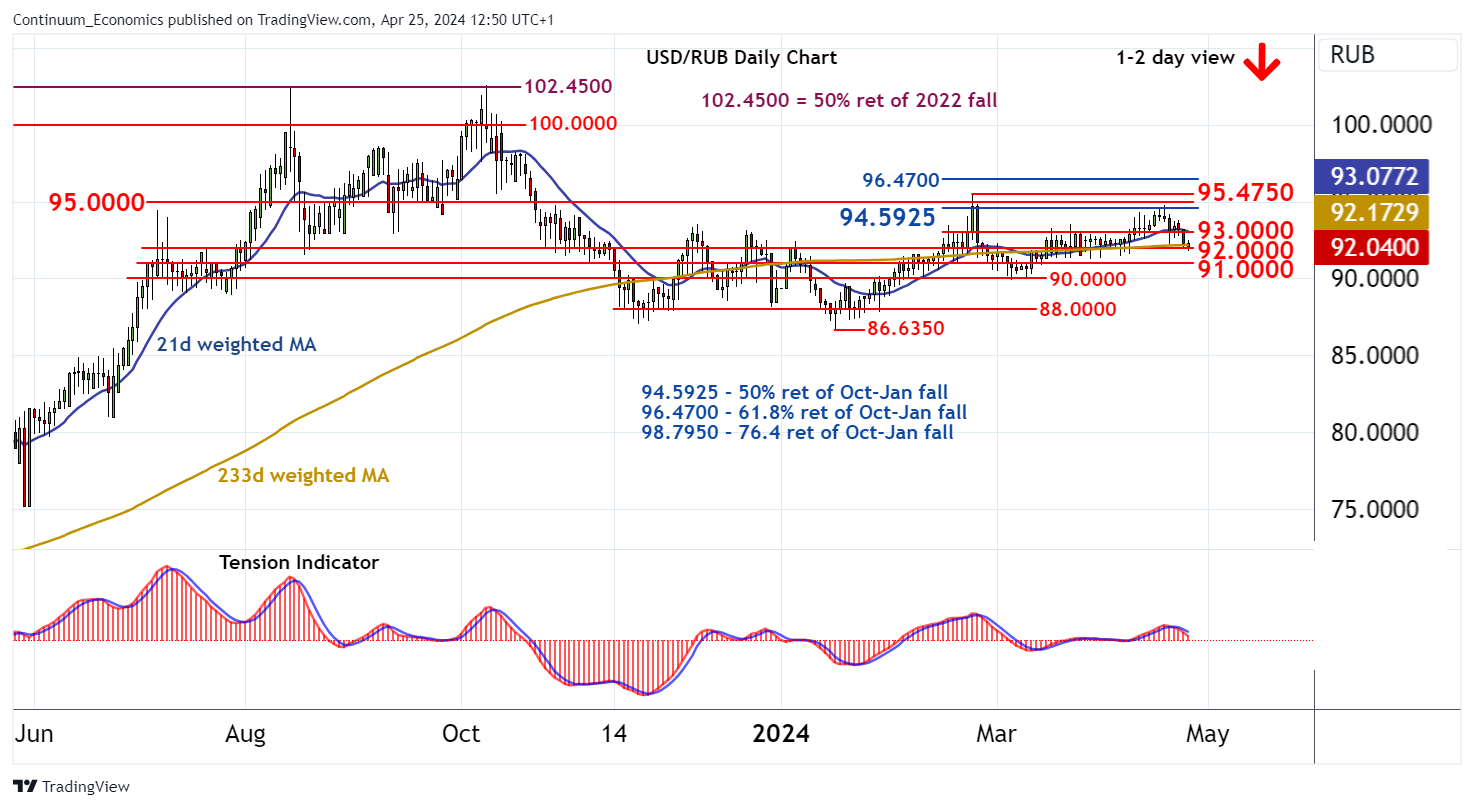
Consolidation is giving way to the anticipated test lower
| Levels | Comment | Levels | Comment | |||||
| R4 | 95.4750 | * | 23 Feb YTD high | S1 | 92.0000 | * | congestion | |
| R3 | 95.0000 | ** | congestion | S2 | 91.0000 | * | congestion | |
| R2 | 94.5925 | ** | 50% ret of Oct-Jan fall | S3 | 90.0000 | * | congestion | |
| R1 | 93.0000 | * | congestion | S4 | 88.0000 | * | congestion |
Asterisk denotes strength of level
12:40 BST - Consolidation is giving way to the anticipated test lower, with prices currently pressuring congestion support at 92.0000. Daily readings are under pressure, highlighting room for a break and continuation to further congestion around 91.0000. Broader weekly charts are under pressure, but a close below 90.0000 is needed to confirm a near-term top in place at the 95.4750 current year high of 23 February, and extend February losses towards 88.0000. Meanwhile, resistance is lowered to 93.0000. A close above here would turn price action neutral and prompt renewed consolidation beneath strong resistance at the 94.5925 Fibonacci retracement.