Published: 2024-04-25T13:30:22.000Z
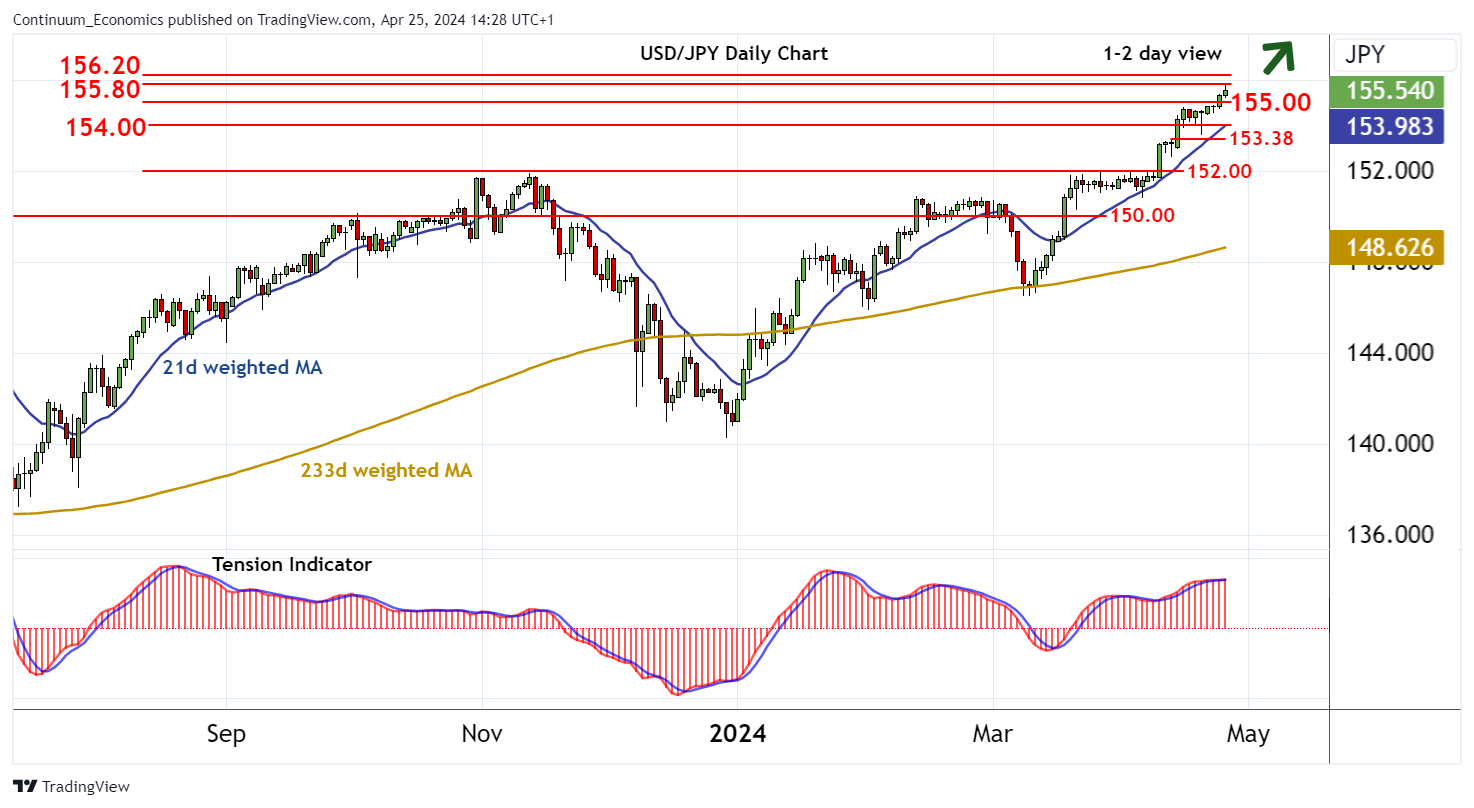
Chart USD/JPY Update: Balanced beneath the 155.80 high of June 1990

Senior Technical Strategist
-
The anticipated test of resistance at the 155.80 high of June 1990 has all but been seen
| Levels | Imp | Comment | Levels | Imp | Comment | |||
|---|---|---|---|---|---|---|---|---|
| R4 | 158.00 | * | figure | S1 | 155.00 | congestion | ||
| R3 | 157.55 | * | 3 May 1990 low | S2 | 154.79 | 16 Apr high | ||
| R2 | 156.20 | * | 19 Apr 1990 low | S3 | 154.00 | * | congestion | |
| R1 | 155.80 | ** | Jun 1990 high | S4 | 153.00 | * | congestion |
Asterisk denotes strength of level
14:15 BST - The anticipated test of resistance at the 155.80 high of June 1990 has all but been seen, with prices settling into cautious trade just beneath here as overbought intraday studies unwind. Daily readings continue to track higher, however, and broader weekly charts are positive, highlighting potential for a later break and continuation of long-term strength towards the 156.20 low of 19 April 1990. Meanwhile, support is at congestion around 155.00. A close beneath here would turn sentiment neutral and prompt consolidation above 154.00.